Data Systems
Analytics Documentation Practice
Ten documents, eighty-seven pages, one shared template. Three case studies in how raw operational data becomes decision-ready output: a Nigerian marketplace, a distributor, and a retail bank.
The brief
What needed to be solved.
Three analytics projects, three audiences, three documentation requirements. A Nigerian e-commerce marketplace needed cleaned data and an executive memo. A distributor needed a dashboard with findings written for operators. A retail bank needed a dimensional warehouse with engineering documentation.
The brief I gave myself was simple: package all three as if they shipped to internal teams. Same document template across all artifacts. Same writing register. Same standard for what counts as decision-ready output.
The constraint
What made it interesting.
Most analytics portfolios show the output. Fewer show the documentation. This project treats documentation as the product: the place where methodology, limitations, query logic, model design, and operating risk become readable.
The work is grouped into three case studies: Marketplace SQL Analytics, Distributor BI Dashboard, and Bank Warehouse Design. Each one includes browser-readable PDFs and editable source documents in the repository.
The build
What was assembled.
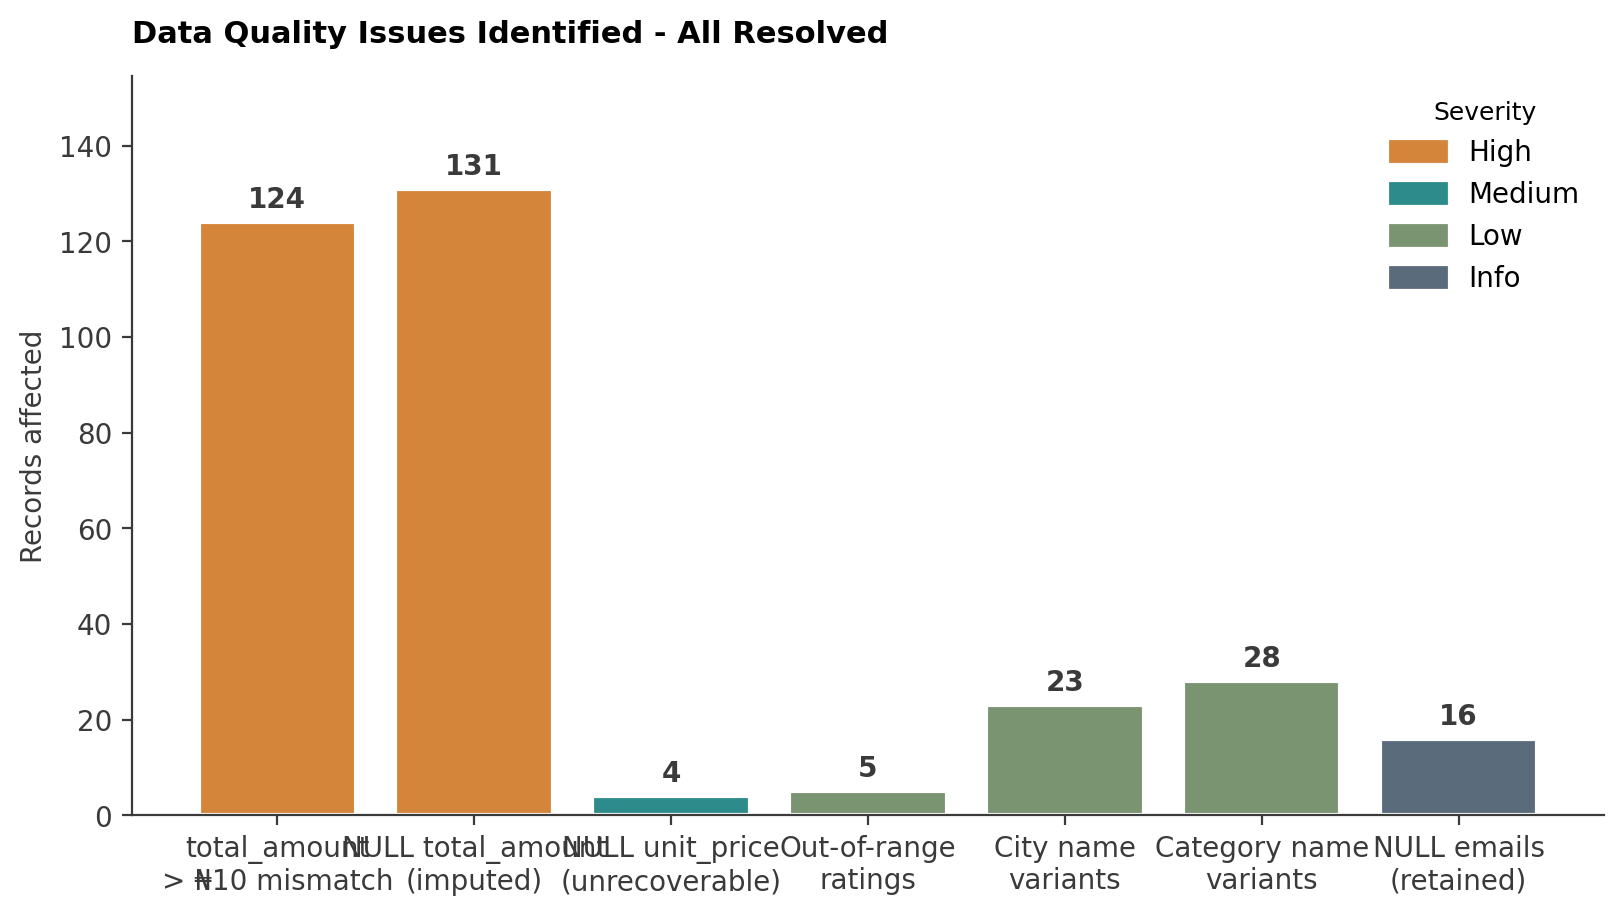
Marketplace SQL Analytics: PostgreSQL cleaning, eight business queries, an executive memo, methodology report, data quality audit, and query documentation pack.
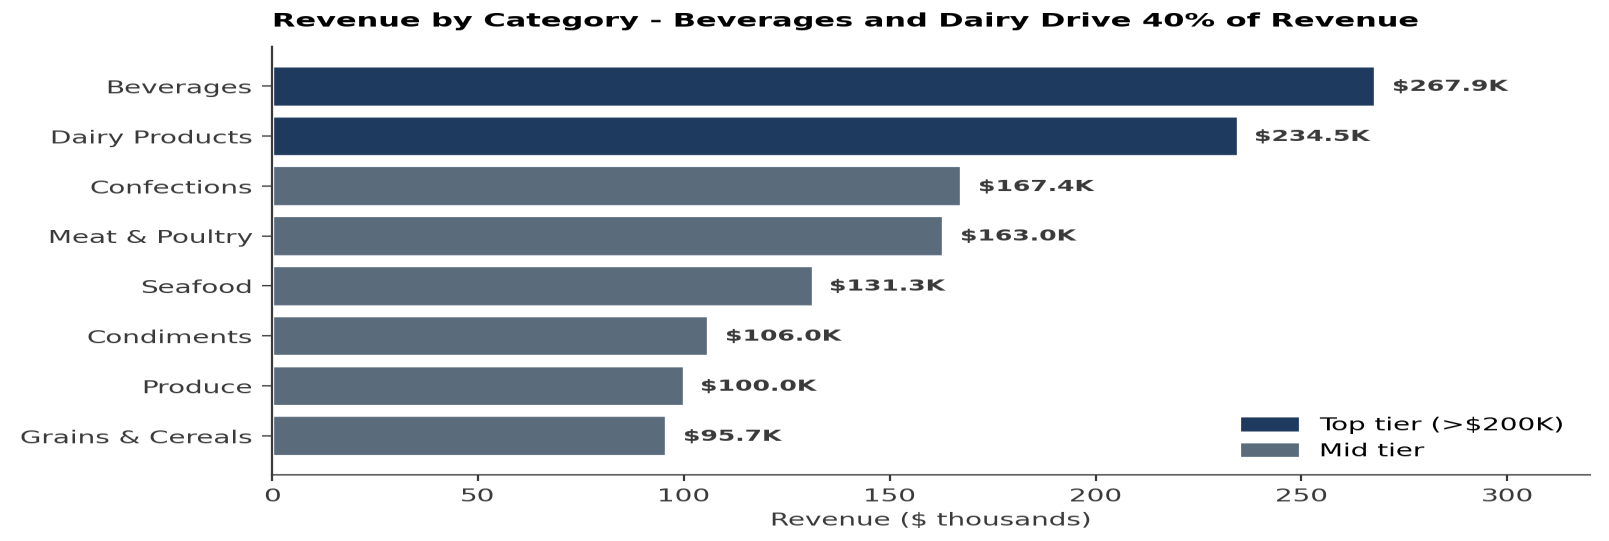
Distributor BI Dashboard: Tableau dashboard work with a methodology report and a findings report built around six findings and five recommendations.
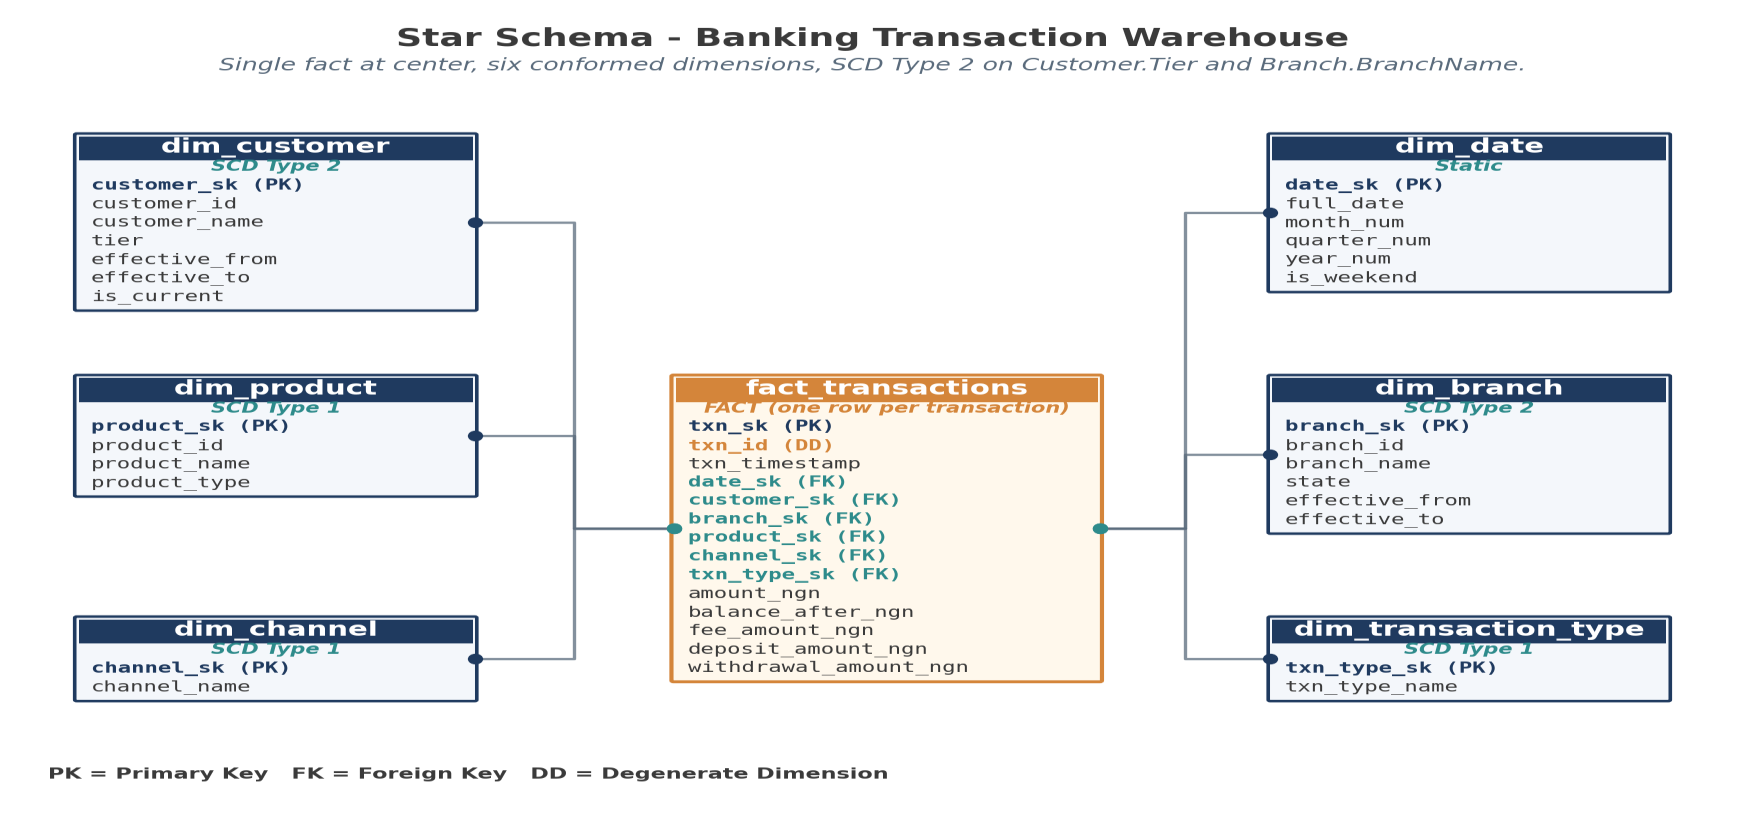
Bank Warehouse Design: PostgreSQL star schema, SCD Type 2 logic, surrogate keys, a dimensional model design, data dictionary, and ETL operations runbook.
The result
What changed after it ran.
Ten finished documents share one template, heading hierarchy, table of contents pattern, chart treatment, and footer system.
Claims anchor to specific numbers and limitations are stated openly instead of hidden behind presentation language.
Anti-slop checks across the bundle returned zero hits for the filler patterns called out in the project repository.
Document previews
Artifacts from the work.
Stack
Read next
AI Retrieval System
RAG Agent in n8n
An n8n workflow that pulls the right context from a source library before answering, so an assistant responds from actual reading instead of guessing. Built so a domain expert can maintain it without touching code.
Read case study →Automation System
Price Update
An n8n workflow that tracked price changes, calculated the deltas, and sent a clean report on schedule. Replaced manual weekly checking with one repeatable reporting flow.
Read case study →